
For financial advisers and professional investors only – not for distribution to retail investors.

Why Winton Global Alpha?
May 2026

This article has been written by Winton. The Winton Global Alpha Fund is brought to you by Macquarie Professional Series.
Trend following tailwinds
The Winton Global Alpha Fund (‘Fund’) has delivered strong uncorrelated double-digit absolute returns in the last 5 years after Winton refocused the Fund in late 2020 on the core trend strategy underpinning the firm’s reputation.
Winton Global Alpha Fund Performance vs. Fund Benchmark and Morningstar Australia Fund Alternative - Systematic Trend category
Swipe for more
| YTD | 1-year | 3-year (p.a.) | 5-year (p.a.) | Since May 2007 (p.a.) | |
|---|---|---|---|---|---|
| Winton Global Alpha Fund | 9.9% | 15.1% | 10.0% | 11.5% | 7.0% |
| Barclay CTA Index ('Fund Benchmark') | 4.9% | 7.0% | 4.1% | 4.0% | 3.0% |
| Morningstar Australia Fund Alternative - Systematic Trend category ('Peer Group') | 8.2% | 16.6% | 7.8% | 8.3% | 7.0% |
Source: Winton, Morningstar as at 31 March 2026. Past performance is not indicative of future results. The Fund performance is shown net of fees. For current Fund performance visit our website.
This absolute performance has been driven by the sustained trends that have emerged in the post-pandemic world: the European energy crisis of 2021, the inflation shock of 2022, the collapse in the Bank of Japan continuing to hold rates below zero through 2023, climate-driven rallies in cocoa and coffee in 2024, and the debasement trade leading precious metals to soar in 2025. We have seen more of the same in 2026, with energy prices soaring amid renewed conflict in the Middle East.
Winton Global Alpha: gross calendar-year contribution by sector since 2021
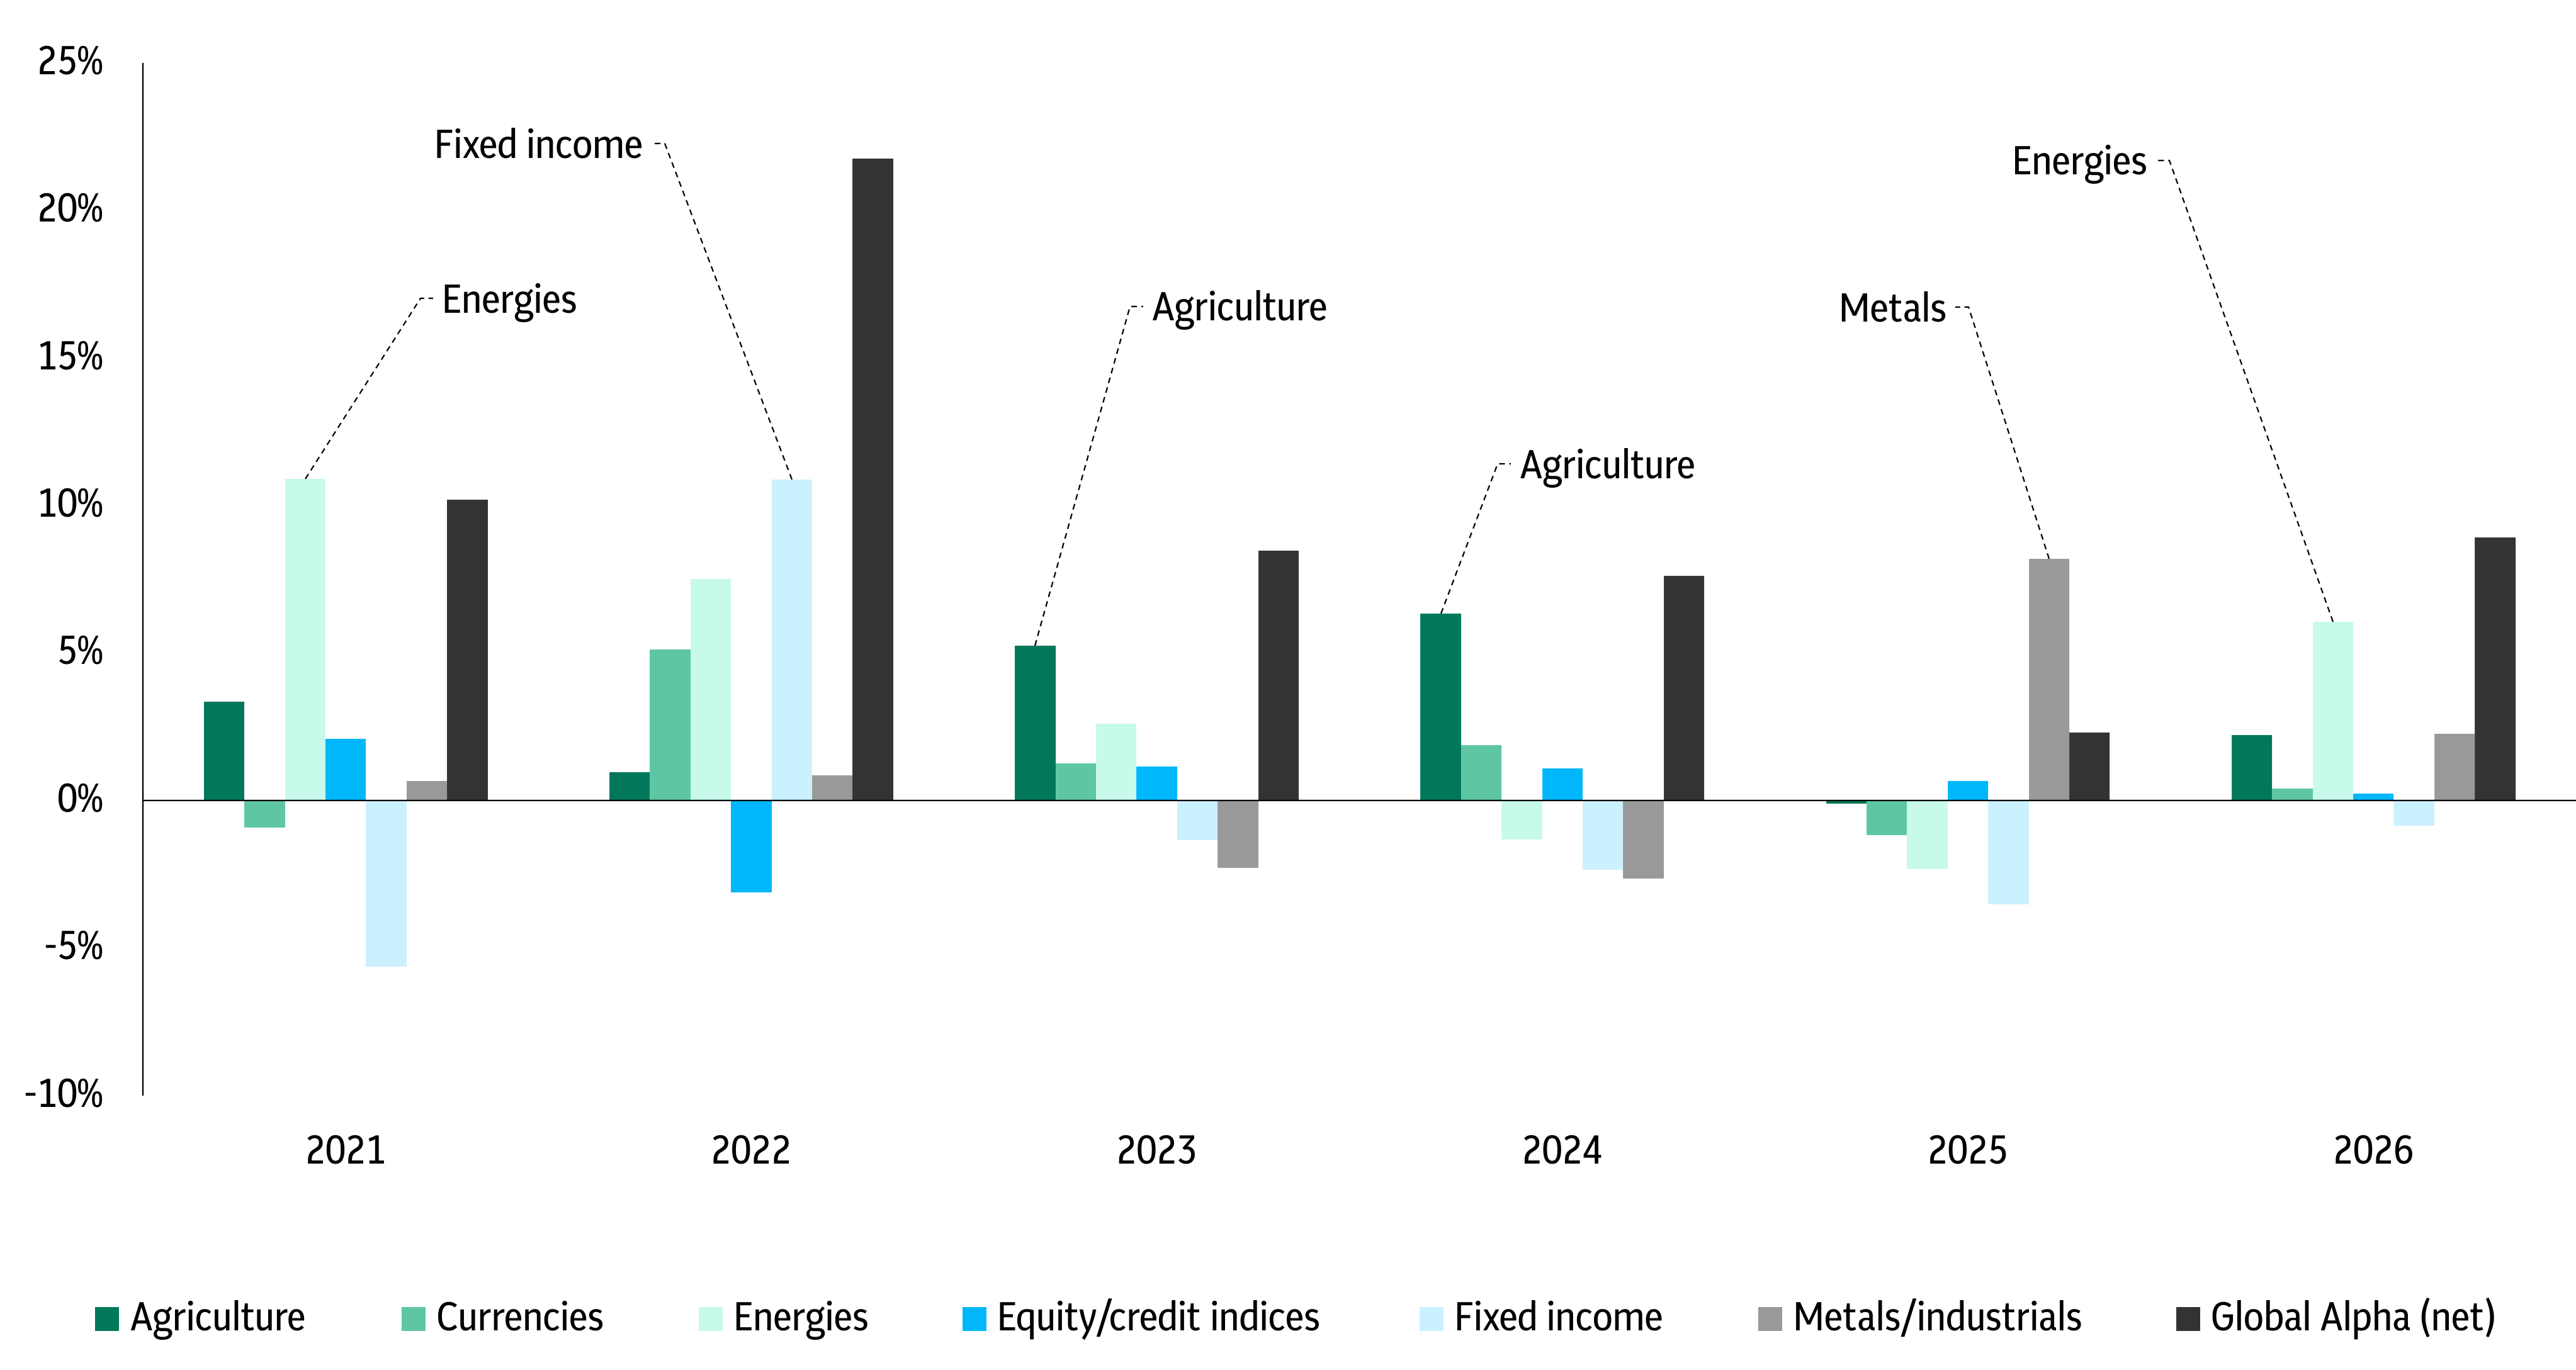 Source: Winton, Morningstar, Societe Generale, as at 31 March 2026. Attribution is gross of fees.
Incremental drivers of outperformance
The Fund has now outperformed the Fund Benchmark and Peer Group over the past three and five years.
This outperformance versus the Peer Group has not been driven by a single factor, but rather a range of incremental enhancements driven by nearly three decades of research:
- The inclusion of the full breadth of exchange-traded and OTC markets – and appropriate weights – means that the Fund has provided substantial exposure to novel and highly profitable trends in everything from power and cocoa to cattle and precious metals.
- The Fund’s 25% allocation to diversifying signals has added considerable value in more challenging environments for trend following, such as in 2023 and 2024.
- The Winton’s multifaceted risk management has mitigated losses during major trend reversals, such as the collapse of Silicon Valley Bank in March 2023, “Yenmageddon” in August 2024, “Liberation Day” in April 2025 and, once again, as war broke out in the Middle East in March 2026.
Why Winton Global Alpha Now?
The investors who have historically had the most success with trend-following strategies are those who maintain a core long-term allocation, rather than attempting to time their exposure.
Why? Because those times when the enduring diversification properties of trend following are most needed are almost impossible to predict.
There are, however, three reasons why we think adding a core allocation might be especially prudent today:
1) Elevated macro uncertainty
Crude oil to US$150 a barrel or back down to US$55? No one knows for sure as it will depend largely on how the current crisis in the Middle East – which involves extremely unpredictable actors – plays out.
Systematic trend-following strategies – like Winton Global Alpha – have the potential to fare well in this type of environment, last evidenced in 2022 when equities and bonds fell and the fund gained 21.8%. The reason for this is that the fund:
- Does not rely on forecasts based fundamental data, which becomes unreliable in these types of scenarios.
- Takes an unemotional, rules-based view of markets, incrementally increasing and reducing their positions based on the direction in which prices are moving.
- Has the dynamism to be long or short across all the world’s major liquid asset classes, whether that is long energies in the current situation or shorting stocks in an equity bear market and bonds in an inflationary environment.
2) Genuine diversification
The Winton Global Alpha Fund trades a global universe, long and short, spanning energies, metals, crops, meats, chemicals, freight, currencies, interest rates, bonds and equity indices.
Examples of markets traded
Swipe for more
| Agriculture | Currencies | Energies | Equity/credit indices | Fixed income | Metals/ industrials | |
|---|---|---|---|---|---|---|
| Major macro | Corn | Japanese yen | Crude oil | All ordinaries | Aus 10-year | Gold |
| Idiosyncratic | Orange juice | Polish zloty | Nordic power | Kospi | NZ bills | Lithium |
Source: Winton
The exposures are weighted depending on the underlying diversification properties of the markets, which leads to a tilt – subject to liquidity and other constraints – towards idiosyncratic commodities.
This contrasts with other so-called common “alternative” investments that tend to provide exposure to the same core macroeconomic factors as equities (growth) and bonds (duration), such as direct real estate, REITs, infrastructure, commodities, private credit, private equity and venture capital.
3) Liquidity when liquidity is needed
What is the point of an alternative investment if you can’t benefit from its diversifying properties. CTAs turn liquidity into opportunity — giving investors the flexibility to allocate to lower priced assets when it counts.
The Winton Global Alpha Fund, for example, is managed with a focus on providing daily liquidity and its implementation across the world’s major liquid markets means that these liquidity terms are appropriate when the need for rebalancing portfolios consisting of traditional equities, bonds and cash exposures arise.
This contrasts with many alternative investments today, where investments in illiquid assets may only be sold at extreme discounts at difficult times, if at all.
The Winton Global Alpha Fund is designed for consumers who:
- are seeking capital growth
- are intending to use the Fund as a minor allocation or satellite allocation within a portfolio
- have a minimum investment timeframe of five years
- have a high or very high risk/return profile for that portion of their investment portfolio, and
- require the ability to have access to capital within one week of request.
The Target Market Determination (TMD), available at macquarie.com/mam/TMD, includes a description of the class of consumers for whom the Fund is likely to be consistent with their objectives, financial situation and needs.
You might also like
Related products
Important Information
For financial advisers and professional investors only – not for distribution to retail investors.
This information is provided by Macquarie Investment Management Australia Limited (ABN 55 092 552 611 AFSL 238321), the issuer and responsible entity of the Fund(s) referred to above. This is general information only and does not take account of the investment objectives, financial situation or needs of any person and before acting on this information, you should consider whether this information is appropriate for you. It should not be relied upon in determining whether to invest in a Fund. In deciding whether to acquire or continue to hold an investment in a Fund, an investor should consider the Fund’s product disclosure statement and the Website Disclosure Information available at macquarie.com/mam or by contacting us on 1800 814 523. This information is intended for recipients in Australia only. Nothing in this document constitutes a recommendation to buy, sell or hold any financial product, security or instrument.
The Target Market Determination (TMD), available at macquarie.com/mam/TMD, includes a description of the class of consumers for whom the Fund is likely to be consistent with their objectives, financial situation and needs.
Future results are impossible to predict. This document contains opinions, conclusions, estimates and other forward-looking statements which are, by their very nature, subject to various risks and uncertainties. Actual events or results may differ materially, positively or negatively, from those reflected or contemplated in such forward-looking statements. Past performance information shown herein, is not a reliable indicator of future performance. No representation or warranty, express or implied, is made as to the suitability, accuracy, currency or completeness of the information, opinions and conclusions contained in this document. In preparing this document, reliance has been placed, without independent verification, on the accuracy and completeness of information available from external sources. To the maximum extent permitted by law, no member of the Macquarie Group nor its directors, employees or agents accept any liability for any loss arising from the use of this document, its contents or otherwise arising in connection with it.
Other than Macquarie Bank Limited ABN 46 008 583 542 (“Macquarie Bank”), any Macquarie Group entity noted in this website is not an authorised deposit-taking institution for the purposes of the Banking Act 1959 (Commonwealth of Australia). The obligations of these other Macquarie Group entities do not represent deposits or other liabilities of Macquarie Bank. Macquarie Bank does not guarantee or otherwise provide assurance in respect of the obligations of these other Macquarie Group entities. In addition, if this website relates to an investment, (a) the investor is subject to investment risk including possible delays in repayment and loss of income and principal invested and (b) none of Macquarie Bank or any other Macquarie Group entity guarantees any particular rate of return on or the performance of the investment, nor do they guarantee repayment of capital in respect of the investment.